
Creating a suitable mesh for your FEA simulations is crucial for getting accurate results. In this blog post, we discuss how to check entities reported in mesh Information, Warning, and Error nodes; how to view the statistics of a mesh or parts of a mesh; and how to plot a mesh and mesh-specific quantities and delimit these plots to selected regions.
Editor’s note: This blog post was updated on July 6, 2022, to reflect new features and functionality in version 6.0 of the COMSOL Multiphysics® software.
Inspecting Entities Reported in Information, Warning, and Error Nodes
We sometimes encounter information, warning, and error messages while building a mesh. When this happens, we should inspect the entities listed in the accompanied Information, Warning, and Error nodes. Many messages are caused by using mesh settings that are too coarse, preventing thin regions and short edges from being resolved properly.
To find these geometric entities, we can use the Zoom to Selection button in the Settings window, next to the Selection list. Toggling off the Mesh Rendering button and toggling on the Wireframe button for 3D meshes lets us easily see the entities reported inside the geometry, as shown below. Use the Measure button, available from the toolbar or the Graphics context menu for selected entities, to get the length of edges or distance between points.


A mesh of an MTB fork (left), where some boundaries are indicated as having narrow regions that are not properly resolved by the current mesh size settings. The same boundaries, highlighted in blue, after clicking the Mesh Rendering and Wireframe buttons (right).
With our measurements and information about the entities, we can then set up Remove Details, Virtual Operations, or CAD Defeaturing, to eliminate the small geometric entities or reduce the mesh size if the features are important for the simulation. Learn more about the use of Remove Details and CAD Defeaturing in this blog post and the following tutorial series. The tutorial Adjusting the Element Size for the Unstructured Mesh Generator demonstrates how to modify mesh size parameters.
A message referring to a problematic location with one or several coordinates is indicated by red points in the Graphics window. There is a button, Center at Coordinates, that enables us to zoom in on a selected location. The button Clip Around Coordinates adds a Clip Sphere around the coordinates, which makes it easier to inspect the face mesh close to the problematic region. The button Remove Clipping removes the Clip Sphere to again see the full mesh. Red points indicate the problematic locations so that the particular region can be studied in detail.
When a message indicates that one or more low-quality elements has been generated, it might require some special attention. In this case, the Minimum element quality of the mesh appears in the Settings window next to the message. Another way to check the Minimum element quality is in the Statistics window. By plotting the mesh elements of the worst quality (explained in further detail later in this post), you get information about where the elements of worst quality are located.
If we have a negative mesh quality or the values are very close to zero, it indicates that the reported mesh elements are inverted or nearly inverted. Low-quality elements can lead to difficulties for the solver to converge or make the solution sensitive to small changes in the mesh. Note that inverted linear mesh elements, which we discuss here, are not the same phenomenon as inverted curved elements that you may run into when solving. Inspecting the curved elements will be discussed at the end of the blog post.
Viewing the Statistics of the Mesh
One way to quickly get an overview of the created mesh is to have a look at the statistics in the Mesh Statistics window, which we open by right-clicking the Mesh head node.

The Mesh Statistics window, showing a wide variety of statistics for different selections and quality measures.
It is possible to change the selection of domains, boundaries, or edges for which we display the numbers. For this, we use the Geometric Entity Level drop-down menu at the top of the window. The Quality Measure menu lets us choose from a list of quality measures, including:
- Skewness
- Maximum angle
- Volume versus circumradius
- Volume versus length
- Condition number
- Growth rate
- Curved skewness
About the Quality Measure Options
The Skewness measure is a suitable measure for most types of meshes; hence, it is the default measure. This quality measure is based on the equiangular skew that penalizes elements with large or small angles as compared to the angles in an ideal element. This quality measure is also used when reporting bad element quality during mesh generation. With the Maximum angle measure, only elements with large angles are penalized, making this option particularly well suited for meshes where anisotropic elements are desired, such as boundary layer meshes.
Volume versus circumradius is based on a quotient of the element volume and the radius of the circumscribed sphere (or circle) of the element. This quality measure is sensitive to large angles, small angles, and anisotropy. For triangular meshes in 2D and tetrahedral meshes in 3D where isotropic elements are desired, Volume versus circumradius is a suitable measure. On the other hand, Volume versus length is based on a quotient of element edge lengths and element volume. This quality measure is primarily sensitive to anisotropy.
The Condition number quality measure is based on properties of the matrix transforming the actual element to an ideal element. The Growth rate is based on a comparison of the local element size to the sizes of neighboring elements in all directions.
The Curved skewness quality measure is a measure of the deformation when generating the higher-order element (the curved elements).
Notes on Mesh Quality
For all quality measures, a quality of 1 is the best possible and it indicates an optimal element in the chosen quality measure. At the other end of the interval, 0 represents a degenerated element. Although the meshing algorithms in COMSOL Multiphysics try to avoid low-quality elements, it is not always possible to do so for all geometries. High geometric aspect ratios, small edges and faces, thin regions, and highly curved surfaces may all lead to poor-quality meshes. When the geometry does lead to a poor-quality mesh, the mesher returns the poor-quality mesh for examination, rather than no mesh at all.
Depending on the quality measure used, the Minimum element quality, Average element quality, and the Element Quality Histogram sections will change accordingly. To get accurate results, it is important to know which Minimum element quality and Average element quality are sufficient for your particular application.
There are no absolute numbers to present for what the quality should be, as the physics and solvers used will have different requirements on the quality needed. To gain confidence in the accuracy of your result, it is recommended to perform a mesh refinement study.
In general, elements with a quality below 0.1 are considered poor quality for many applications. The mesher will automatically inform the user if the quality is poor and warn the user if the quality is very poor, as elements of very poor quality should be avoided in most cases. In some cases, a couple of low-quality elements may be okay if they are located in a part of the model with less importance, while in other cases, one low-quality element may lead to convergence problems.
The histogram in the Mesh Statistics window will give us a visual of the quality of the mesh, which can be a quick way to see if we need to change the overall mesh sizes in some way.
Creating a Mesh Plot
To understand where low-quality elements are positioned and which mesh size parameters to change, it can be a good idea to perform a plot of the mesh. We do this either by clicking the Plot button in the Mesh ribbon or by right-clicking the Mesh head node of the mesh we would like to plot and selecting Plot. This gives us a Mesh dataset, available under Results > Datasets, under which we can add Selections to narrow down the amount of entities shown in the plot. The Mesh plot feature can also be combined with other plot features.
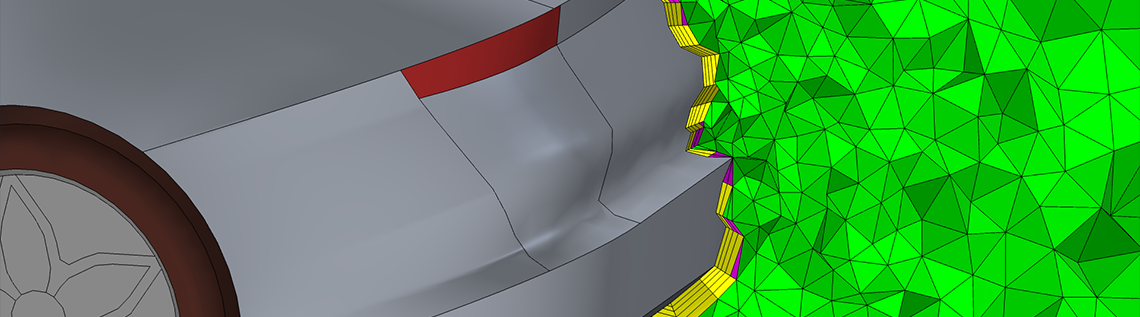
We can gain a general understanding of how a specific mesh is set up by the different types of mesh elements. To do so for a volume mesh, we set Level to Volume and select Type from the Element Color list. This will automatically color the mesh elements according to their type. In the image below, you see the boundary layer mesh around a sports car.

A colorful representation of the different element types in the mesh of the model Large Eddy Simulation of a Sports Car. The tetrahedrals are shown in green, the pyramids in magenta, and the prisms in yellow. To understand more about how the elements are connected, they are filtered by the expression y > 0.
As we already mentioned, it can be important to understand where the elements of poor quality are located. This will help us understand if the geometry needs to be changed in any way or if the mesh size needs to be modified to better handle the problematic area.
We can start by setting Level to Volume and in the Element Filter section selecting the Enable Filter check box. Then, we enter a Boolean expression, which reflects the elements we want to check. In the image below, the elements with a Skewness below 0.04 are shown. We can use the Replace Expression feature to easily access the names of the different quality measures. These measures can be used to spot different weaknesses in the generated mesh, so we should make sure we check all of them to see which is best used for our particular meshes.

The volume elements for the expression qualskewness below 0.04 are displayed for the Shell-and-Tube Heat Exchanger model. In front of the Graphics window, the Replace Expression window gives easy access to the different quality measures.
Among the quality measures, the Growth Rate is a bit different, as it shows a relation between two mesh elements, whereas the other quality measures display the quality of the shape of each single mesh element. The growth rate evaluates toward a maximum of 1 in regions of the mesh where the elements are constant in size. It is lower in regions where the element growth rate increases from one element to the next. The most important things to plot are often happening inside the mesh of a domain, while it can be good to add a filter expression including the space dimensions. Here is one such example:

The growth rate displayed for the mesh of the Biconical Antenna model. The plot shows that the elements in the swept mesh in the PML domains are of similar size, while the growth rate shifts more in the tetrahedral mesh in the middle domains. In this example, the mesh elements for where x > 0.01 mm are shown by using the Element filter option. The slice plot shows the Electric field norm (dB).
Lastly, the quality measure Curved skewness is used when you want to inspect the curved elements, or higher-order elements, that you typically solve for. Set the appropriate Geometric shape function in the Mesh dataset. Please note that it is possible to select any shape function, regardless of what you solve for, so double-check the Discretization settings for your physics interface if you are unsure which one to choose. It is possible to filter out elements of bad quality in the same way as for any quality measure, to better understand where the geometry or mesh settings might need some fine tuning.

A plot showing the Curved skewness. The Geometric shape function is set in the Mesh dataset.
Concluding Thoughts on How to Inspect Your Mesh in COMSOL Multiphysics®
We have discussed three different ways of inspecting a mesh, which can be used to spot regions with low-quality mesh elements. Now that we know how to find out where the low-quality mesh elements are, we can either manually adjust the mesh in these regions or address the issues with the underlying CAD geometry itself. To learn about modifying CAD geometries for meshing purposes, see the following blog posts and webinar video:
- Working with Imported CAD Designs
- Using Virtual Operations to Simplify Your Geometry
- Improving Your Meshing with Partitioning
- Analyzing Meshes in COMSOL Multiphysics®
Want to evaluate the meshing capabilities of COMSOL Multiphysics for your own modeling needs? Contact COMSOL via the button below:


Comments (7)
Ivar KJELBERG
February 15, 2018Hi Hanna
Nice Blog, I have been searching for quite some time how to highlight the mesh elements that COMSOL decides to linearize to avoid “inverted elements” errors.
This was not straightforward, finally I have got to the following cookbook receipt:
Settings to be used :
================
1) select the Plot reference to solved Data Set (and not the Mesh) for the variable “linearizedelem” to be correctly referenced.
2) select “Volume” or “All” elements (not the default “Surface”).
3) select “Element Filter” – “Logical expression” – “linearizedelem”.
4) optional: to get a better view set the “Shrink Elements” to 0.8
I believe this is worth to add in your blog, as this remains for me one of the most common error message I get from your solver.
Sincerely
Ivar
Hanna Gothäll
May 31, 2018Hi Ivar,
I’m glad to hear that you found the blog interesting.
The warning given in the solver log is “Using linear geometry shape for mesh elements near coordinate” followed by one or more coordinates. How to plot and avoid these higher order inverted elements is discussed in this section in the documentation:
COMSOL Multiphysics Reference Manual > Meshing > Meshing Techniques > Avoiding Inverted Mesh Elements.
To be able to inspect inverted higher order mesh elements, your steps above show one way of plotting these elements so thanks for adding that to this blog post. Another way to do it is to add a “Volume” plot and add linearizedelem as the “Expression”. As this only plots the values 0 and 1, using the setting “Smoothing: None” in the “Quality” section will give the wanted look. If the elements are located inside of the domain, add a “Filter” node below the “Volume” node and enter linearizedelem==1 in the “Expression” field.
To avoid these elements, select the “Avoid inverted curved elements” check box in the “Element Quality Optimization” section of the “Free Tetrahedral” node.
Ernest DeLugo
October 31, 2018Need advice help in meshing:
Is there a general rule of thumb in selecting the shape element and element size in starting good meshing, that is preferred as a starting point, in order to reduce computation time and yield good results? Thank you for your help and time.
best personal regards,
Ernie
email: erniedelu1@aol.com
Hanna Gothäll
November 1, 2018Hi Ernie,
As a general rule of thumb, I would go with the default Discretization setting. Which element size to choose very much depends on your specific application. We recommend that you do a mesh refinement study for a typical application set up as discussed earlier in this blog article:
https://www.comsol.com/blogs/how-to-implement-mesh-refinement-study
This will give you an idea of which mesh element size is needed to resolve the physics you are solving. If you have further questions, feel free to send the model MPH file over to support@comsol.com and we will continue the discussion there.
Christian Workman
July 11, 2022Your instructions above provide one method of plotting inverted higher order mesh elements, therefore I appreciate you contributing that to this blog post. Adding a “Volume” plot and adding linearizedelem as the “Expression” is another method. The desired appearance can be achieved by selecting “Smoothing: None” in the “Quality” column, as this only plots the numbers 0 and 1. Add a “Filter” node below the “Volume” node and put linearizedelem==1 in the “Expression” field if the elements are inside the domain heardle game
Theo Theodosiou
May 29, 2023Dear Hanna,
I am a bachelor student of chemical engineering and I use Comsol for my thesis.
One of my requirements is to explore the different meshes for my model. Unexpectedly the simulation time for Normal Mesh is much higher than the one for fine, finer and extra fine. The skewness test does not show any information that would suggest why. Is there an explanation on why that may happen ?
Hanna Gothäll
May 30, 2023 COMSOL EmployeeDear Theo,
Apart from badly shaped mesh elements, the mesh size also need to resolve the physics related phenomena in your model in order to get good convergence. However, it is difficult to say what might be the explanation for your particular set up of geometry and physics, so please send your MPH file along with your questions to support@comsol.com so that we can take a look.